Understanding Network Performance in a Multi Regional Solution
Cloud infrastructures are distributes systems by default, caused by the fact that multiple systems are connected via a network to execute a desired task. A distributed system design massively increases the complexity of building and operating these solutions. In the introduction of the famous Distributed Systems Course MIT 6.824 there is already this kind of ironic warning "...if you can possibly solve it on a single computer ... without building a distributed system you should do it that way". Having an honest assessment of our situation this warning is definitely a bit late for us.
Looking at typical enterprise solutions consisting of different SAP SaaS Cloud products of the SAP Business Suite like S/4 HANA, SuccessFactors, Ariba, SAP Sales Cloud,... SAP Legacy Solutions on-premise or operated on Infrastructure as a Service (IaaS), 3rd party solutions and last but not least the SAP Business Technology Platform (BTP) you automatically end up in a massively distributed system. To make things even harder, these systems could be spread out to very different locations, spanning even different continents. In the context of hyperscalers (Infrastructure and platform providers like Amazon Web Service, Google Cloud Platform or Microsoft Azure), these locations are referred to as "regions".
However, the distribution of services to different locations is not just an obstacle to deal with, often there are valid business reasons behind using certain datacenter locations, like regulatory requirements, security and cost considerations and, you might guess it, performance requirements.
Many SAP customers do business in a vast number of countries, running services and solutions in different locations and regions becomes a business requirement and imperative.
Designing such a global network of services for a certain customer specific solution and fitting it into an overarching enterprise architecture is a complex undertaking. As with any architectural concept, the ability of making intelligent tradeoffs is a most required skill.
This document will have a look at the performance impact of wide area network connections and the effects of using different services for the connections. Instead of guessing the performance we will use a distributed measurement system to understand the impact of different architectural decisions. In the final section we will discuss the findings and results from former tests that have been executed using the distributed measurement environment and will derive some best practices and rules of thumb that can help architects in designing their distributed system landscape for SAP solutions.
Definition of network performance:
From Wikipedia, the free encyclopedia:
Network performance refers to measures of service quality of a network as seen by the customer.
The following (performance) measures are often considered important:
- Bandwidth commonly measured in bits/second is the maximum rate that information can be transferred
- Throughput the actual rate that information is transferred
- Latency the delay between the sender and the receiver decoding it, this is mainly a function of the signals travel time, and processing time at any nodes the information traverses
- Jitter variation in packet delay at the receiver of the information
- Error rate the number of corrupted bits expressed as a percentage or fraction of the total sent
To get a deeper understanding of the measures refer to the wikipedia article mentioned above.
Architecture
The architecture describes a distributed testing landscape that can be used to measure network performance aspects in a multi-regional, multi-provider setup. Although it can be used with all kinds of different network payloads, the focus is currently on OData, which is a common protocol that many SAP products and solutions use to connect user interface frontends (UI) with the respective backends. It is the default communication method for UIs with SAP S/4HANA and for any apps that have been built using the SAP Cloud Application Programming Model (CAP) on SAP BTP.
In the existing example the OData services from the "Manage Sales Orders" SAP Fiori app were used to request data from an S/4HANA Cloud Private Edition instance.

The solution architecture consists of the following parts:
- The Worker Nodes Specialised Docker containers simulate UI requests by issuing OData calls to the S/4 HANA Backend system. For this purpose a docker container containing the load testing tool Apache JMeter has been created.
Using a container simplifies deployment to different environments. The container can be deployed to anything from a docker desktop installation on a local workstation or virtual machine, to different container runtimes like AWS Elastic Container Service (ECS), Azure Container Instance (ACI) or Google Cloud Run, all kinds of Kubernetes environments like Kyma on SAP BTP and even Cloud Foundry. This deployment flexibility makes it easy to simulate different user locations.
-
The Controller Node The controller node runs another instance of JMeter. It is responsible for scheduling and controlling the load test operations on the different worker nodes. It uploads the measurement results to the dashboard.
-
The Dashboard The Dashboard consists of 2 docker containers:
-
A Container running Grafana. According to Wikipedia Grafana "is a multi-platform open source analytics and interactive visualization web application. It can produce charts, graphs, and alerts for the web when connected to supported data sources." It is very often used for technical dashboards, e.g. in observability use cases.
-
A Container running InfluxDB. Wikipedia states: "InfluxDB is a time series database (TSDB) developed by the company InfluxData. It is used for storage and retrieval of time series data in fields such as operations monitoring, application metrics, Internet of Things sensor data, and real-time analytics..."
For deployment the InfluxDB container and the Grafana container should be co-located on a container runtime and orchestration system. In our example both containers are deployed as a single Kubernetes Pod on SAP's Kubernetes offering SAP BTP, Kyma Runtime but any other Container management and runtime solution would work, too.
The Grafana dashboard is used to group and analyze the performance results that have been uploaded to InfluxDB as single records.
 Screenshot of the Grafana Dashboard
Network performance of different BTP and Hyperscaler regions and connection options
Designing the location strategy for a multi-regional SAP solution setup comes with its own challenges.
Let's have a look at a simplified scenario:
A customer has started on their "Rise with SAP" journey. For their S/4HANA Cloud Private Edition, they have to choose an infrastructure (IaaS) provider. In many cases one of the Hyperscalers AWS, Azure or GCP would be the preferred choice. Usually, these systems will be augmented and extended by solutions on SAP BTP, e.g. SAP Integration Suite, SAP Workzone or extensions based on the SAP Cloud Application Programming Model (CAP) with HANA Cloud as a backend.
Aspects to consider:
- Availability of a BTP service in a certain region
- Availability of a BTP service on a specific hyperscaler (IaaS provider)
- Some connection options like the SAP PrivateLink service are only available on some providers and require the S/4HANA Cloud system and the connected BTP subaccount to be on the same hyperscaler platform (AWS or Azure)
- User location and network distance between BTP subaccount and S/4HANA system
The network location and provider decisions for BTP subaccounts and the S/4HANA Cloud system decisions caused by these aspects have an impact on the network performance. Especially network throughput and latency do influence the response times of the API calls on the network and with this they have a major impact on the perceived solution performance by the user.
Besides service location and the resulting network distances in our distributed network, different connection options and services on BTP like SAP Cloud Connector (SCC), SAP Private Link Services, other network proxies like the Cloud Foundry App Router and the SAP BTP Destination Service or a custom-build app can have an impact on the network performance.
The network routing itself can have an impact, too. All major hyperscaler IaaS providers operate their own global fibre backbones to connect their different regions but of course you can make use of the public internet, too. However, this is not always transparent to the customer. Different from working with Infrastructure-as-a-Service resources on hyperscalers like Amazon Web Services, Google Cloud or Microsoft Azure, where you are in full control of the Software-Defined-Network (SDN) you rarely get in contact with the low level networking setup when using the SAP BTP Platform-as-a-Service (PaaS).
To understand the impact of different connection options, several test options have been developed:
To evaluate the impact of a BTP service on network performance we need to define the baseline. In our case this is a direct connection between the simulated client and S/4HANA Cloud. Obviously you get the best possible network performance if BTP subaccount and S/$HANA Cloud Private Edition are placed in the same Hyperscaler region. To make all test cases comparable the same OData service and and API calls are used.
The baseline (no BTP involved):
- Direct OData call from worker node to the S/4HANA system (SAP Gateway)
- using public IPv4 address if the worker node and the S/4HANA systems are connected via the public internet (not recommend for production use)
- you can use private IPv4 addresses if S/4HANA and the worker node are on the same private network

Minimal BTP scenario using Cloud Foundry App as proxy:
- OData call from worker node to the S/4HANA system using the Cloud Foundry App Router as a proxy

- OData call from worker node to the S/4HANA system using the Cloud Foundry App Router as a proxy via SAP Cloud Connector

- OData call from worker node to the S/4HANA system using the Cloud Foundry App Router as a proxy via SAP Private Link service.

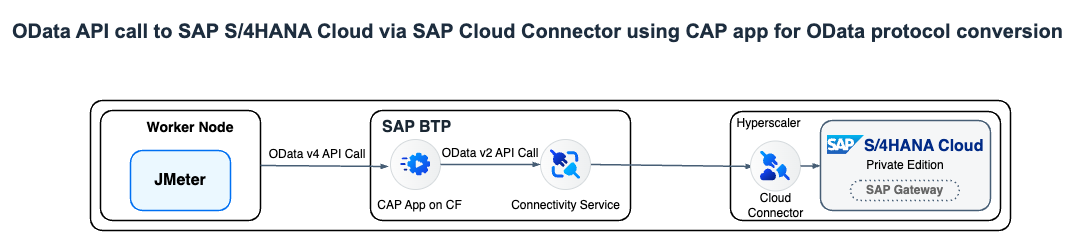
Indirect calls via BTP CAP application:
- A CAP app on a BTP subaccount is used to consume the OData service on the S/4HANA system. The CAP app converts the OData v2 service into OData v4 that is consumed by our worker node simulating the client.

- A CAP app on a BTP subaccount is used to consume the OData service on the S/4HANA system via SAP Cloud Connector.
- A CAP app on a BTP subaccount is used to consume the OData service on the S/4HANA system via SAP Private Link service.

Considerations for the test execution
To get comparable, statistically significant and meaningful results, some general guiding principles could be useful:
-
Number of consecutive calls To get a higher statistical significance a certain number of measurement records is needed. Repeating the test a few hundred times helps increasing the significance.
-
Parallel calls In a real life scenario concurrent users will use the system. Besides a load effect on the different services in the scenario this will require a higher network bandwidth and result in higher total network throughput if the available bandwidth allows.
-
Ramp-up calls To measure the network performance, you need to make sure the system response time for the backend system is stable. Using a number of ramp-up calls for warming up the system, that are not part of the measurement, can ensure more consistent response times from the backend server and decrease interference when measuring the network performance.
-
Comparing network locations One of the goals of measuring the network performance is to compare different client locations, BTP subaccount regions and backend locations. Additionally, daytime, day of the week or other time related extra-ordinary events can impact network performance.
By running the different location checks in consecutive batches the risk of interference from changed network conditions can be possibly compensated because the probability is higher that all runs are affected by the these overall network conditions.
A typical example config could be a structure like (from the current example repo - the URL is subject to change soon)
    "Region": "NA",
    "Type": "Daily",
    "ThreadGroup": {
        "Threads": 5,
        "Rampup": 10,
        "Loop": 250
    },
    "ScenarioConfigFolders": "S4H,CAP,ROUTER",
    "JMeterWorker": {
        "ExecutionType": "sequential",
        "Hosts": [
            {
                "IPAddress": "10.31.0.4",
                "Name": "CanadaCentral"
            },
            {
                "IPAddress": "10.32.0.4",
                "Name": "CanadaEast"
            },
            {
                "IPAddress": "10.33.0.4",
                "Name": "EastUS2"
            },
            {
                "IPAddress": "10.34.0.4",
                "Name": "SouthCentralUS"
            },
            {
                "IPAddress": "10.35.0.4",
                "Name": "WestUS2"
            }
        ]
    }
Statistical analysis and evaluation of the results data
Every OData api call that flows through the test course is part of the result set and is ingested into the InfluxDB of the dashboard. Grafana is used to group and analyze and present the data.
A typical configuration for the data that is ingested into InfluxDB can look like this:
  "sample_variables":
    "grpLabel",
    "Scenario",
    "ConnectionType",
    "BTPHost_Name",
    "SCCHost_Name",
    "S4HHost_Name",
    "UserHost_Name",
    "statistics-approuter-total",
    "statistics-scc-total",
    "statistics-total",
    "statistics-icmtotal",
    "ping-s4h"
In addition to the total response time per call execution, some of the services report back their own detailed statistics and add it to the http response header for each call. These can help identifying how much time is spent inside these services and are included in the result set, too.
Services that report back their own performance data are:
- Cloud Foundry App Router:
statistics-approuter-total - SAP Cloud Connector:
statistics-scc-total - Internet Connection Manager of S/4HANA Cloud system:
statistics-icmtotal

The dashboard is using different statistical funtions to group the data. E.g. median has been included as an additional value because average can be heavily biased by outliers in the results set.
The following groupings can be interesting for the main attribute Response Time:
AverageAverage value (might be biased from outliers and ramp up calls)MedianMedian value (50% percentile – much less impact from outliers)90/95/99th PercentileThe nth percentile is the smallest score that is greater than or equal to a certain percentage of the scores. To rephrase this, it’s the percentage of data that falls at or below a certain observation
Conclusions from past performance tests
Performance tests in Europe, North America and Asia, using the described architecture have lead to some first insights, some of them unexpected:
- The response times did not exceed critical 150ms for all test constellations tested in Europe (OData standard request with result set of 10 sales orders)
- Test results from Canada are comparable to Europe results, using a BTP subaccount on AWS (Montreal CA10) with a SAP S/4HANA Cloud system on Azure in Canada Central (Toronto) provides slightly better performance than using Azure Region East US (Ashburn, VA US21)
- SAP BTP subaccount and SAP S/4HANA should be placed geographically close to each other (especially for data intensive extensions and analytical scenarios)
- Cross hyperscaler traffic e.g. SAP S/4HANA on Azure to SAP BTP on AWS did not have any negative performance impact (response time and throughput) compared to using the hyperscaler's own fibre backbones
- We could not find a significant performance difference between SAP Cloud Connector and SAP Private Link
- Most hyperscalers will try by default to keep traffic on their own network if both orgin and target are on the same hyperscaler even when using public IPs (aka "cold potato routing"). However, this behavior is configurable.
Network performance is not the only criteria for designing a multi-regional setup for a SAP solution. Other non-functional aspects like regulatory requirements, (high) availability requirements, security and cost considerations could require different decisions, leading to trade-offs on the performance side. It is also important to understand the network performance requirements of the business solution. A good application architecture can often mitigate performance bottlenecks on the network.
Resources
- The sourcecode and setup instructions for the performance testing landscape can be found on GitHub. However, the project is currently undergoing some rework and the URL is subject to change.